
Bitcoin has pulled back from last week’s move above $87,000 as renewed U.S.-Iran tensions pressured risk assets and interrupted its September rebound.
CoinGecko data showed Bitcoin falling below $84,000 during Monday trading after reaching a seven-day high above $87,000 last week. $BTC later recovered toward the $84,000–$85,000 area as traders assessed geopolitical risk and the next batch of U.S. economic data.
Ethereum faced similar pressure after trading above $2,700 last week, while XRP consolidated near $1.50. The moves followed gains across major cryptocurrencies during the previous week.
More Than Just News
Content, live market tracking, portfolio management, and price alerts — everything you need in the Crypto News app.
Download now, stay on top of the crypto market, and take control of your information. 

The major crypto remains well above its mid-September lows near $75,000–$77,000. CoinGecko historical data show $BTC closing near $75,590 on Sept. 15 before climbing above $86,000 less than a week later.
Bitcoin price falls as Iran uncertainty returns
Geopolitical risk returned to markets after U.S. President Donald Trump rejected an Iranian proposal linked to reopening the Strait of Hormuz and pausing the conflict.
According to Reuters, Iranian Foreign Minister Abbas Araghchi said Tehran remained prepared to seek a diplomatic settlement while warning that the country was ready if fighting resumed.
Iran presented a plan during the United Nations General Assembly that included a seven-day period to reopen the Strait of Hormuz and pause fighting before negotiations on unresolved issues.
Trump rejected the proposal and said Iran was seeking an agreement because it faced military and economic pressure. He separately wrote on Truth Social that Iran “cannot have a nuclear weapon.”
Speaking Sunday, Trump said he expected the conflict to end “very soon” but declined to rule out further U.S. strikes before the November midterm elections.
“I don’t want to say that. I don’t want to say that. I mean, it’s possible, but I just don’t want to say that,” Trump said when asked whether military action could resume, according to Fox News.
Araghchi, meanwhile, said Iran was “fully prepared” for another conflict and warned that Tehran could withstand what he described as a potential “doomsday war.” His comments represented Iran’s stated position and did not indicate that new military action had been confirmed.
Oil markets remained sensitive to developments around Hormuz. WTI crude futures traded above $93 during Monday’s early session, while Brent posted similar gains as traders watched the negotiations.
The Strait of Hormuz remains a major shipping route for oil and liquefied natural gas from Gulf producers.
Bitcoin ETF inflows remain firm despite pullback
The $BTC price decline followed one of the stronger weeks for U.S. spot Bitcoin ETF demand in September.
U.S. spot Bitcoin exchange-traded funds recorded $2.39 billion in net inflows during the Sept. 21–25 trading week, according to Farside Investors data cited by crypto.news.
Every trading session during the week recorded positive flows. BlackRock’s IBIT accounted for around $1.16 billion of the total.
As crypto.news previously reported, $BTC moved above $87,000 after the Federal Reserve raised its target range to 3.75%–4.00% on Sept. 16.
Spot Bitcoin ETFs subsequently attracted roughly $2.65 billion during five trading sessions through Sept. 23.
In related coverage, Bitcoin traded near $84,000 on Sept. 24 after rejecting the $87,000 region. Wallets holding between 100 $BTC and 1,000 $BTC had accumulated 113,950 $BTC since July 15, while Binance Bitcoin open interest had fallen by roughly $500 million after the rally.
Open interest remains part of the current market setup.
Crypto analyst Wealthmanager wrote on X that $BTC open interest had returned to the same area seen before the previous price advance.
“Leverage is getting flushed while price holds $84K–$85K,” the analyst said, adding that the previous reset was followed by a move toward $87,000.
$BTC OI just reset to the same floor we saw before the last major push.
Leverage is getting flushed while price holds $84K–$85K. The last time this happened, $BTC ran toward $87K.
I’m bullish here. This looks more like fuel being cleared for the next leg than a top being… pic.twitter.com/EcKkxZGAmU
— Wealthmanager (@Wealthmanager) September 27, 2026
The analyst described the current setup as bullish but separately said $BTC still showed a bearish internal structure over shorter time frames.
Wealthmanager identified $80,300 as a potential support level if $BTC extends its pullback. The view is an analyst projection and does not represent a confirmed price outcome.
Separately, Trader Merlijn The Trader compared $BTC’s current chart with Google’s post-2021 recovery pattern and questioned whether $BTC could follow a similar path. The comparison is a market scenario rather than a verified forecast.
I ALMOST TURNED BEARISH ON THIS BITCOIN PULLBACK.
Then I looked at Google’s post-2021 recovery.
What if $BTC is following the same path? pic.twitter.com/dPEUbO5XMs
— Merlijn The Trader (@MerlijnTrader) September 27, 2026
Bitcoin indicators show momentum cooling
Bitcoin’s daily chart shows price consolidating after its rebound from September lows near $75,000–$77,000.
The Money Flow Index stands at 59.35. A reading above 50 indicates positive buying pressure, while the indicator remains below the commonly watched overbought zone near 80.
The Know Sure Thing indicator remains positive. KST stands near 89.71 compared with its signal line around 83.32.
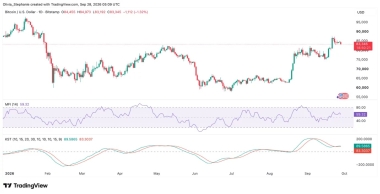 Bitcoin ($BTC) price chart, source: TradingView
Both lines have moved lower from their September peaks, showing that positive momentum has cooled from the levels seen during the recent rally.
$BTC continues to face resistance around $86,000–$87,000. As crypto.news reported, the area between roughly $86,700 and $87,400 had already emerged as resistance during the September rebound.
The latest pullback brought $BTC back toward that region before price recovered above $84,000.
A break below the $83,000–$83,600 zone would put the $80,000–$81,000 area back in focus. A recovery above $86,000 would bring the recent high around $87,000 into view again.
U.S. inflation and jobs data come next
Bitcoin traders now face several U.S. economic releases that could influence Treasury yields and Federal Reserve rate expectations.
The Bureau of Economic Analysis is scheduled to publish August personal income and spending data on Sept. 30 at 8:30 a.m. Eastern Time.
The report includes the Personal Consumption Expenditures price index, the Federal Reserve’s preferred inflation measure.
September employment figures are scheduled for Oct. 2 at 8:30 a.m. Eastern Time, according to the Bureau of Labor Statistics.
The ISM manufacturing report is due during the same week, giving markets another reading on U.S. economic activity.
Treasury yields have risen sharply since the conflict with Iran began. The 10-year yield moved above 5% as oil prices, inflation concerns, rate expectations and U.S. debt issuance remained in focus.
$BTC entered the week after gaining strongly during the third quarter despite higher yields and geopolitical uncertainty. Its next move will come as traders watch the $83,000 support region, the $86,000–$87,000 resistance area and this week’s U.S. inflation and employment releases.