
The United States spot Bitcoin (BTC) exchange-traded funds (ETFs) ended their five-day winning streak on Thursday, amid bearish sentiment.
After attracting more than $1.6 billion earlier in May, as Finbold reported, the U.S. spot BTC ETFs closed May 7 with an outflow of $277.50 million, according to data from SoSoValue analyzed by Finbold on May 8. Despite this outflow, these funds collectively hold approximately $106.77 billion in Bitcoin at press time.
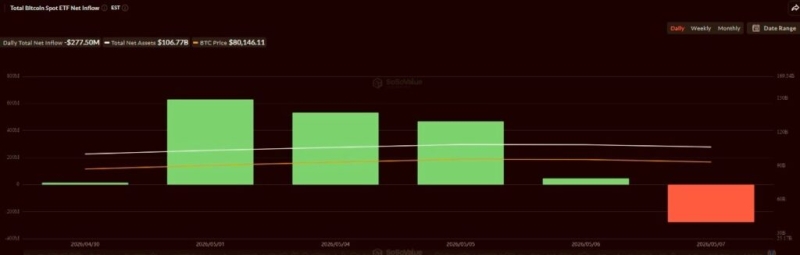
BTC spot ETFs daily flow. Source: SoSoValue
The U.S. spot Bitcoin ETFs registered their highest daily inflow in six days on May 1, at about $629.73 million. In the following days, investors gradually reduced their appetite for BTC, with some exiting the space.
BlackRock’s iShares Bitcoin Trust (IBIT) recorded a net cash outflow of $98.02 million on Thursday, reflecting a small sell-off after it had purchased BTC valued at over $1 billion over the past five days. Consequently, IBIT controls assets worth nearly $75.8 billion at press time.
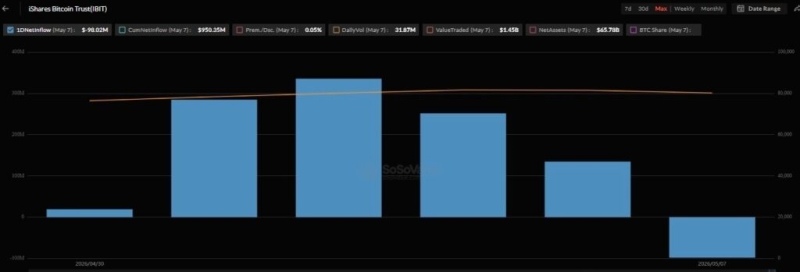
IBIT daily flow. Source: SoSoValue
Meanwhile, Fidelity Wise Origin Bitcoin Fund (FBTC) has recorded two consecutive days of net cash outflows totaling $167.94, thereby ending its four-day inflow streak. As of publication, FBTC’s assets totaled $15.24 billion.
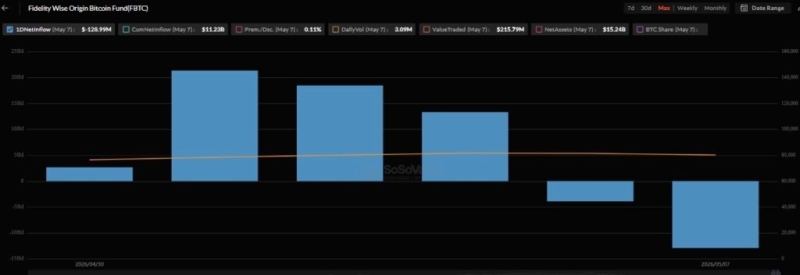
FBTC daily flow. Source: SoSoValue What’s next for Bitcoin price amid mixed spot flow?
The notable cash inflows into U.S. spot BTC ETFs have signaled a potential resurgence in demand from long-term investors. At the same time, the supply of Bitcoin across all crypto exchanges declined by 9,832 BTCs, from 2,686,423 on May 1 to 2,676,591 on Friday, as per metrics from CryptoQuant.

XRP News Today: International Finance Bank Confirms XRP As Payment Rail, And Is Income The New Crypto Narrative For 2026?
XRP is back in crypto chatter after an internal presentation by International Finance Bank highlighted its role in financial infrastructure. … Continue reading
Featured Press Release Apr 26, 2026
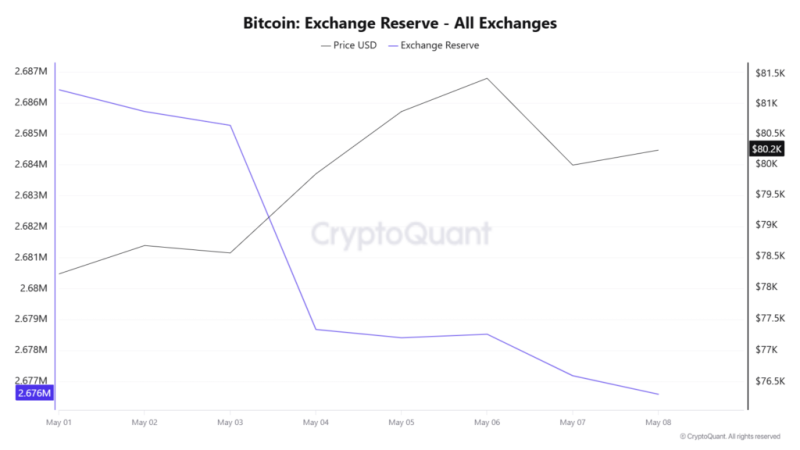
Bitcoin supply on all exchanges. Source: CryptoQuant
Amid a 0.37% decline in BTC supply across all exchanges and net cash inflows into U.S. spot ETFs, the flagship coin gained over 2% during the period, trading at about $80,180.
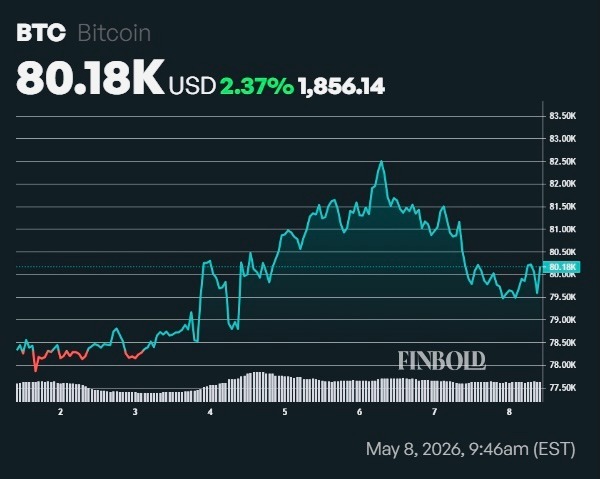
BTC/USD 7-day chart. Source: Finbold
However, the decline in demand from U.S. institutions has weighed down on BTC’s bullish momentum. Notably, the BTC price teased a drop below $80,000 on Friday after being rejected above $82,000 earlier this week, as Finbold analyzed.
As a result, BTC traders must closely monitor the flow of these funds to gauge whether Thursday’s outflows mark a temporary pause or the beginning of a broader reversal.