
Bitcoin is showing signs of strength as its monthly RSI recovers from the low levels seen during its 2026 decline.
Bitcoin analyst PlanB, who has over 2 million followers on X, shared the latest monthly RSI chart from Block Horizon and simply said, “Bitcoin is getting stronger.”
Bitcoin Monthly RSI Moves Back Above 50
The chart, updated on September 24, shows Bitcoin’s monthly RSI at around 54, while its five-month average is about 47.
Earlier in 2026, the RSI fell into the mid-40s, indicating weaker momentum. This decline coincided with Bitcoin’s price drop from $97,860.60 to $57,700 in July, representing a 40.99% decline.
However, Bitcoin has improved significantly since that low. Bitcoin has surged to $87,265 as of this week, representing a 51% gain from the July low.
Accordingly, Bitcoin’s monthly RSI has now recovered above 50, suggesting that $BTC’s momentum is improving. However, the RSI remains well below 70, a level often seen during Bitcoin’s strongest rallies.
The chart also shows that Bitcoin’s RSI has experienced major ups and downs in the past. Major market peaks have often occurred with RSI readings above 85, while major corrections have pushed the indicator below 50.
Therefore, PlanB’s comment suggests that Bitcoin’s momentum is improving following the previous decline.
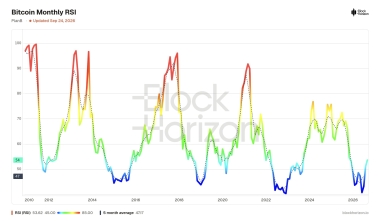 Bitcoin Monthly RSI Chart By PlanB
Gradually Entering a Bull Market
Interestingly, when Bitcoin reached a peak of $126,200 in 2025, its RSI did not reach the typical 80-plus levels seen during previous bull markets. Instead, it reached the mid-70s before the decline began.
On the other hand, the RSI reached the usual bear-market bottom levels below 50, similar to what occurred during previous bear markets.
CoinMarketCap data shows $BTC at around $84,580, up about 1.5% over the past 24 hours and 8% over the past week. The recovery has led to more positive comments from traders on social media, with some suggesting that the bull market has resumed.
X user Riley Coleman said that despite criticism from some bears, Bitcoin’s market structure is getting stronger. “The bears can keep coping all they want on social media, but the math doesn’t care about your feelings,” he said.
Notably, the RSI suggests Bitcoin is gradually entering another major rally. At around 54, the monthly RSI remains in the middle of its historical range and well below the extreme levels seen during previous market peaks.
The key point is that Bitcoin’s monthly RSI has recovered as its price has risen significantly from the July low. If the RSI continues to rise, it would suggest stronger long-term momentum. If it falls below 50 again, it could indicate renewed weakness.
Bitcoin Supertrend Flashes Buy Signal at $84K
Beyond the monthly RSI, Bitcoin’s Supertrend indicator has turned green again around $84,000, signaling a shift back to an uptrend.
The previous green signal appeared in 2023 near $16,000 and remained in place for roughly three years as Bitcoin climbed about 700%, eventually reaching $120,000. The indicator has now turned green again after Bitcoin fell to around $57,700 in July 2026 and subsequently rebounded by about 51%.
The Supertrend indicator uses price and volatility to identify market direction, with green indicating an upward trend.
Bitcoin has also moved back above its 365-day moving average near $83,000 and its 50-week moving average. The next major technical level is around $88,761, the two-year moving average. A sustained move above these levels could signal stronger momentum, although technical indicators do not guarantee future gains.