
Bitcoin (BTC) has triggered an on-chain signal that previously marked the start of two major bull markets, as the cryptocurrency attempts to reclaim the $90,000 level.
Specifically, Bitcoin’s Market Value to Realized Value (MVRV) ratio has crossed back above its 365-day moving average (MA), according to on-chain data shared by Glassnode on September 22.
$BTC has flashed the momentum signal that started the last two bull markets.
MVRV has crossed back above its 365-day average.
This is the same cross that we saw in 2019 and 2023 at the beginning of each bull market. pic.twitter.com/tzFMakLEo3
— glassnode (@glassnode) September 22, 2026
The same crossover occurred during the early stages of the 2019 and 2023 uptrends, making it one of the key momentum indicators closely watched by on-chain analysts.
The signal comes with Bitcoin trading around $85,873 at press time, up more than 50% from its July 1 low of $57,749.
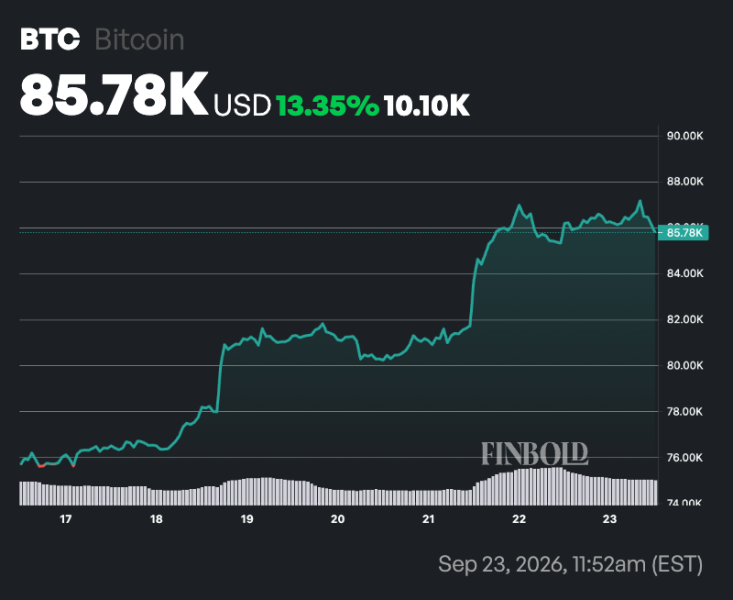
Bitcoin seven-day price chart. Source: Finbold
The MVRV ratio compares Bitcoin’s market value with the aggregate cost basis of coins held across the network. When it moves above its 365-day average, it can signal a shift toward bullish momentum after an accumulation phase.
Glassnode data shows the indicator has recently reclaimed this long-term average after months below it. Unlike previous cycle peaks, however, MVRV remains well below the extreme levels associated with market euphoria, suggesting Bitcoin has yet to enter historically overheated conditions.
Bitcoin network activity spikes
At the same time, large investors continue increasing their activity on the Bitcoin network following the asset’s recent rally.
According to data highlighted by crypto analyst Ali Martinez on September 22, the network processed more than 2,722 transactions worth over $1 million in a single day.
Elevated whale transaction counts are often viewed as a sign of growing participation from institutions, investment funds, and other large market participants.
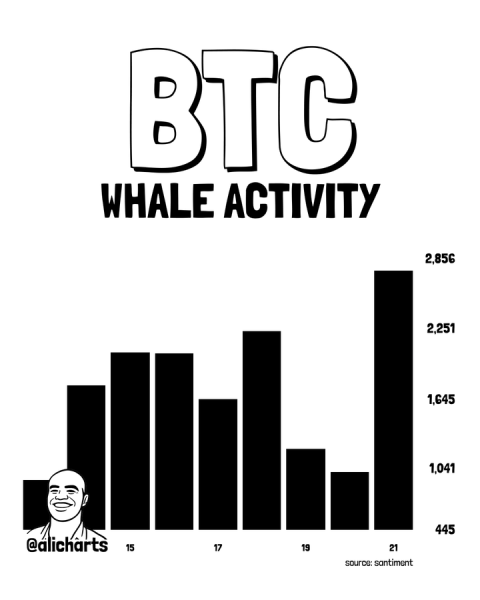
Bitcoin whale transactions chart. Source: Santiment
The surge in high-value transfers suggests major holders remain active despite Bitcoin’s sharp advance from July lows, indicating continued engagement rather than broad profit-taking.
The current bullish sentiment is also being supported by strong institutional demand through U.S. spot Bitcoin exchange-traded funds (ETFs).
Data shows the funds recorded net inflows of approximately $999 million on September 21, followed by another $714.7 million on September 22. BlackRock’s IBIT and Fidelity’s FBTC accounted for a significant share of the capital entering the market.

Bitcoin spot ETF data. Source: CoinGlass
Consistent ETF inflows increase demand for Bitcoin while reducing available supply, a dynamic that has helped support prices throughout the current recovery.
Bitcoin technical structure turns bullish
Meanwhile, Bitcoin’s technical structure has strengthened following a breakout above a large rounded-bottom formation highlighted by TrendSpider.
The pattern, often associated with long-term trend reversals, reflects a gradual transition from selling pressure to sustained buying demand. Bitcoin has also broken above a key resistance zone around $80,000 and continues to hold comfortably above its 50-day simple moving average of $73,689 and 200-day simple moving average of $70,614.
Bitcoin just cleared the rim 👀☕️$BTC https://t.co/dfaNNxiuqs pic.twitter.com/82hLLT6tuS
— TrendSpider (@TrendSpider) September 22, 2026
Momentum indicators remain strong, though they also point to a potentially stretched market in the short term. The 14-day Relative Strength Index (RSI) currently stands at 73.62, placing Bitcoin in overbought territory.
While readings above 70 often confirm strong bullish momentum, they can also signal an increased likelihood of consolidation or a temporary pullback.
Featured image via Shutterstock